Graphs
Dots joined by lines and nothing else; count the lines at a dot for its degree, write the joins in a table of ones, and a design's filled cells become a network.
A graph is two lists. A list of dots, and a list of lines, each line naming the two dots it joins. The dots are called vertices and the lines are called edges. Nothing is said about where a dot sits or how long a line is, only about which pairs are joined, so the same graph can be drawn a hundred ways and stay the same graph.
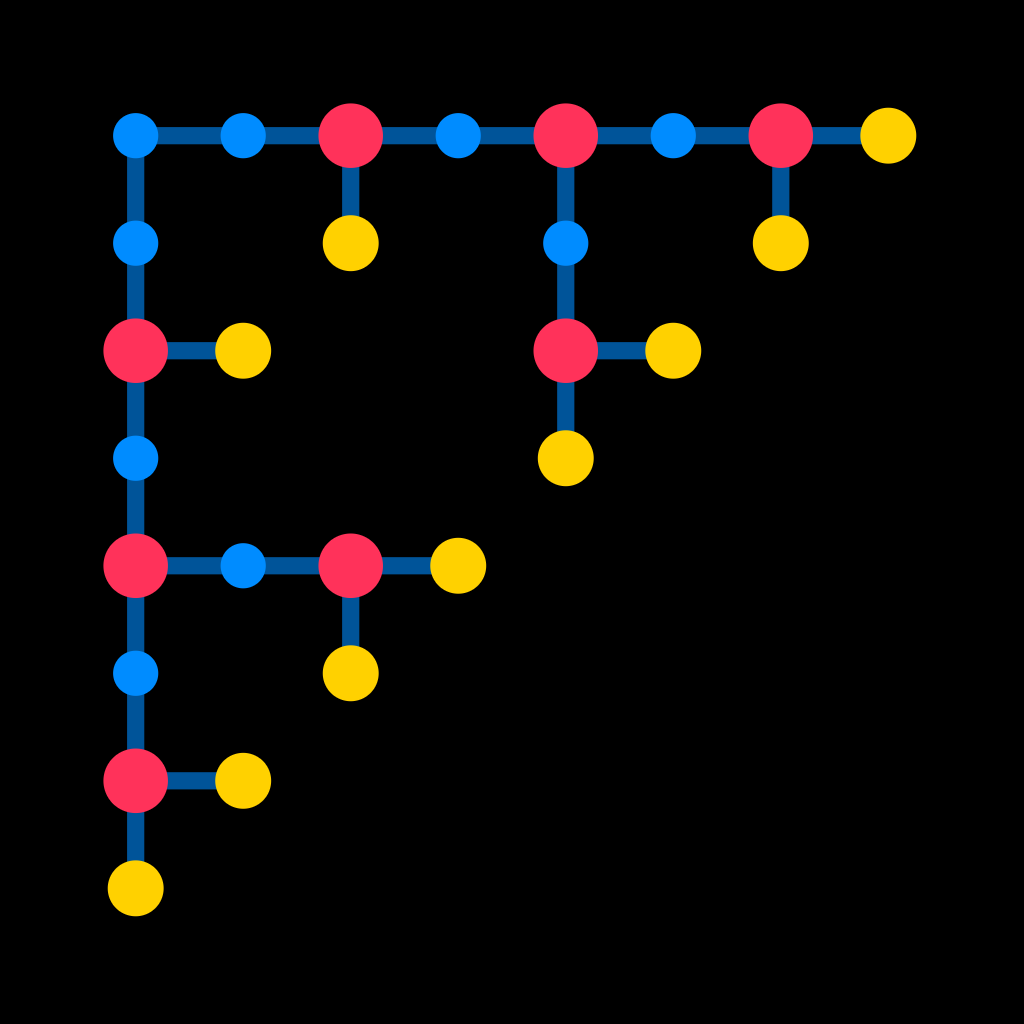
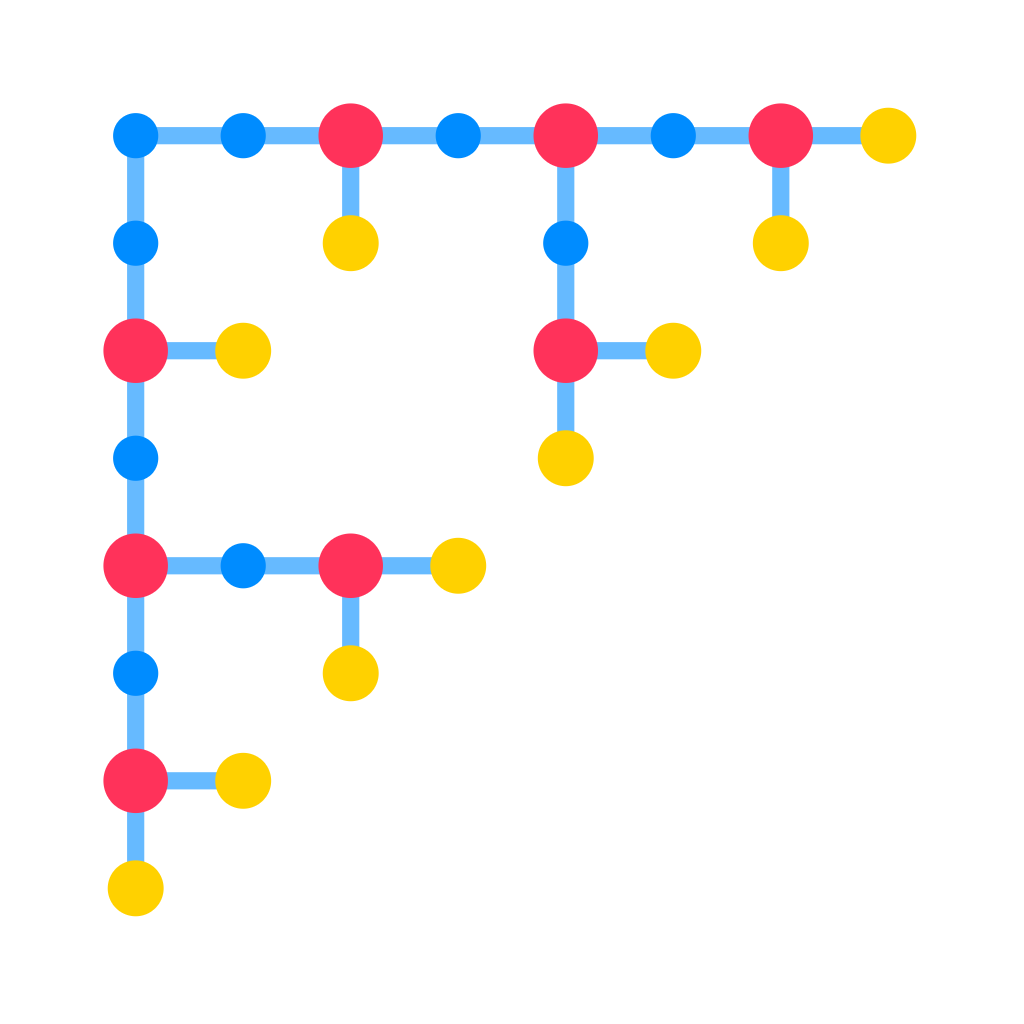
The figure is one. It starts from a shape: the triangle you get by taking a two by two block, keeping three cells and dropping the fourth, then stamping that rule into itself three times. The result is 27 filled cells on a grid 8 cells wide. Put a dot in every filled cell and draw a line between two dots when their cells share a whole side. Cells that meet only at a corner are not joined.
That gives 27 dots and 26 lines. The dots are inked by how many lines meet them, and that count is the degree of the dot. Ten dots in the figure are yellow and have one line each, nine are blue and have two, and eight are pink and have three. No dot has four.
Add up all the degrees and you get 10 + 18 + 24 = 52, which is exactly twice the number of lines. That is never a coincidence. Every line has two ends, so counting ends dot by dot counts every line twice. It is the first fact about graphs worth remembering, and it holds for any graph at all.
The joins can be written as a table instead of drawn. Number the dots 1 to 27 and make a square table with one row and one column for each. Put a 1 in row i column j when dots i and j are joined, and a 0 when they are not. That table is the adjacency matrix. Here it is 27 by 27 with 52 ones in it, it is symmetric because joining is mutual, and its diagonal is all zeros because no dot is joined to itself.
Walking is the next idea. A walk is a list of dots where each one is joined to the next; you are allowed to go back over your tracks. A path is a walk that never uses the same dot twice. A cycle is a path that ends where it began, using at least three dots.
The graph in the figure has no cycle in it anywhere. Start anywhere, walk without immediately reversing, and you can never come home. A graph that is in one piece and has no cycle is called a tree, and a tree always has exactly one fewer line than it has dots. Twenty seven dots, twenty six lines, and the count checks.
Being in one piece has a name too. Two dots are in the same component when some walk runs from one to the other. This graph has one component, so every filled cell can be reached from every other by stepping side to side. A shape whose cells touched only at corners would fall apart into many components instead, and counting components is one of the cheapest things you can ask a graph.
That is why the tree here turns pictures into graphs at all. A design is a set of filled cells. Joining them face to face turns a picture with no moving parts into an object that can be walked on, measured for distance, cut into pieces and made to ring, and every one of those questions is a question about the dots and the lines.
In the tree
The graphs demo builds this network for any design and prints its tips, its junctions, its pieces and its length, flat or in the cube. The walk dimension note drops random walkers on exactly this graph and times how fast they spread. Structure against noise races a design's graph against a random set of the same size on components and boundary, and the complexity note reads the same graph's eigenvalues. The shape in the figure is grown by the Kronecker product.